How to Calculate Food Cost Percentage (With Examples)
By Hamza Ukani · · Updated
- food cost
- menu engineering
- profitability
- restaurant management
Ask ten restaurant owners in India what their food cost percentage is and eight will give you a number from memory. Ask how they got it and the answer is usually purchases divided by sales for the month — which is not food cost, it is purchase cost, and the gap between the two is where the money hides.
Here is the calculation done properly, and what to do with the answer.
The formula
Food cost % = (Opening stock + Purchases − Closing stock) ÷ Food sales × 100The top line is consumption, not purchases. If you bought ₹6,00,000 of stock in a month where you also ran down ₹80,000 of what was already in store, you consumed ₹6,80,000 — and your real food cost is worse than your invoice file suggests.
A worked example
- Opening stock: ₹3,20,000
- Purchases: ₹6,00,000
- Closing stock: ₹2,40,000
- Food sales: ₹22,00,000
Consumption = 3,20,000 + 6,00,000 − 2,40,000 = ₹6,80,000
Food cost % = 6,80,000 ÷ 22,00,000 × 100 = 30.9%
The owner who divides purchases by sales gets 27.3% and believes the restaurant is doing better than it is. Three and a half points on ₹22 lakh of monthly sales is ₹7.7 lakh a year.
The two numbers people get wrong
Closing stock. Counting only the store room and not the walk-in, the bar back-up, the prep fridge and the staff meal ingredients. Count everything, on the same day of the month, with the same person doing it.
Food sales. Total sales, not food sales. If beverages are in the denominator, your food cost percentage looks artificially good and your beverage margin disappears into an average. Track them separately or you are flying on one instrument.
What a good number looks like in India
Treat these as bands, not targets — the right number depends on your format:
| Format | Typical food cost |
|---|---|
| Fine dining | 30–35% |
| Casual dining | 28–33% |
| QSR | 30–35% |
| Cafe / bakery | 25–30% |
| Cloud kitchen (post-commission) | 22–28% |
| Bar (food only) | 28–32% |
A cloud kitchen looks best on this table and usually earns worst, because commission and discount share hit after this line. Never compare formats on food cost alone.
Getting three points back without raising prices
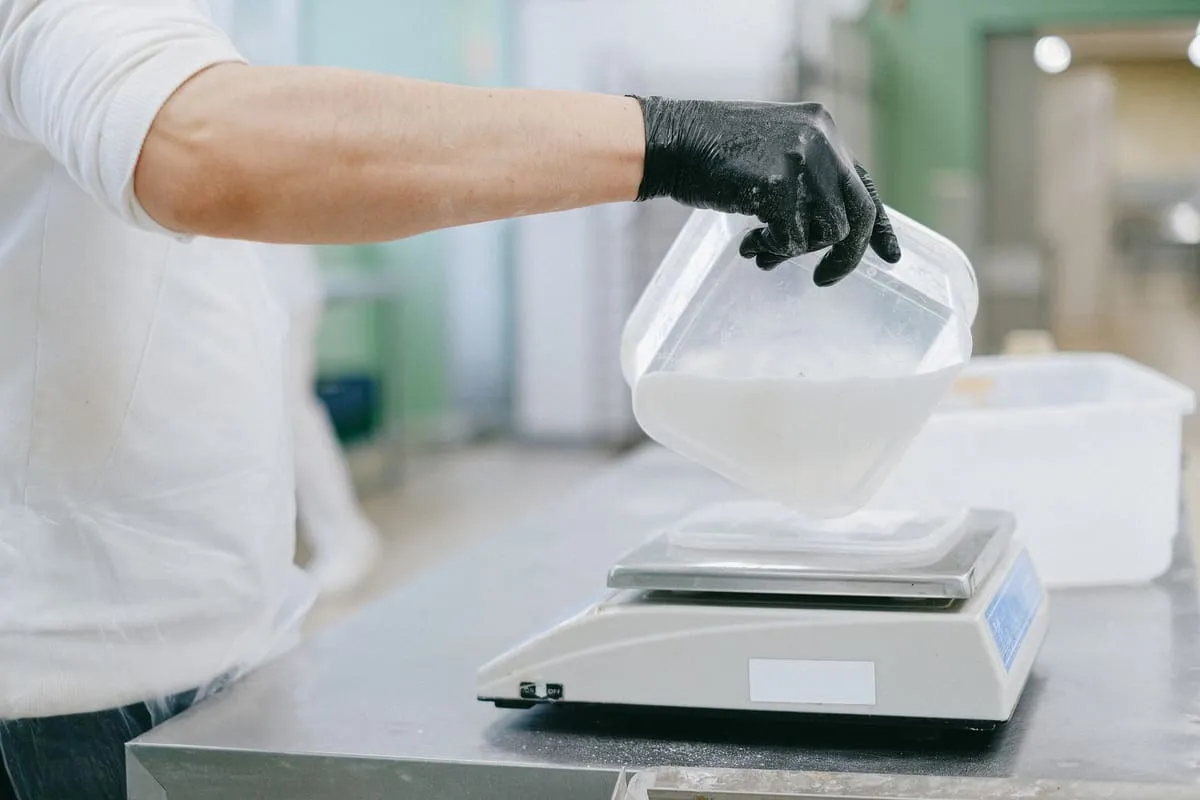
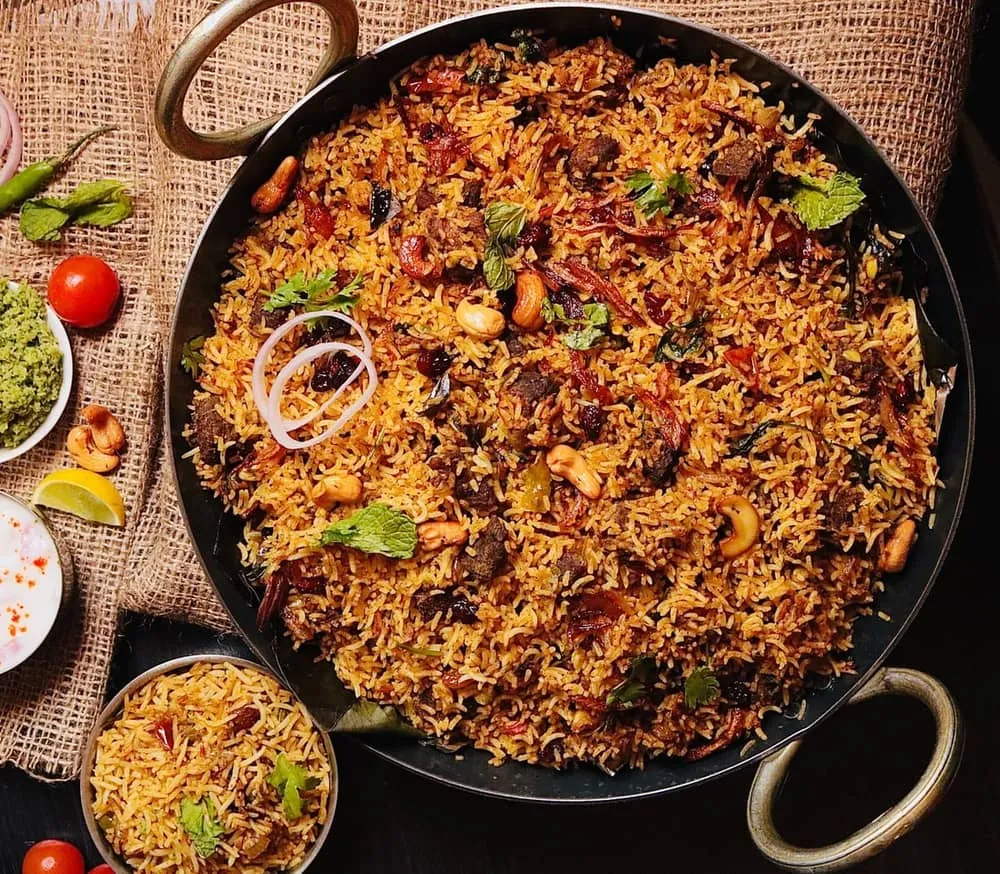
1. Standardise portions. A biryani served by eye varies 15% between two cooks on the same shift. Scoops, ladles and a scale on the line recover more margin than any price rise, and no guest ever notices.
2. Yield test the expensive proteins. A kilo of raw chicken does not become a kilo of cooked portions. Test it, cost the actual yield, then reprice the dish against the truth.
3. Cut the dogs. “Dog” is the menu engineering term, from the matrix Michael Kasavana and Donald Smith developed at Michigan State in the early 1980s, for items that neither sell nor earn. Items that neither sell nor earn still consume prep labour, storage and wastage. The dish you keep for the two regulars who order it is costing you more than those two regulars spend.
4. Set par levels and stick to them. Over-ordering is how fresh produce becomes wastage on a Tuesday. Par levels against actual covers by day, not against a nervous chef’s instinct. The UN’s Food Waste Index puts food service at 28% of all food wasted worldwide, and most of a restaurant’s share is decided at the ordering desk, not the bin.
5. Count staff meals. They are consumption. If they are not tracked, they distort your percentage and hide a real cost. Feed the team properly, from a defined staff menu, and account for it.
Food cost per dish: the recipe card
The monthly percentage tells you whether there is a problem. The recipe card tells you where.
For every dish, write down each ingredient in grams, the cost per gram at today’s purchase price, and add it up:
| Biryani (one portion) | Grams | Cost |
|---|---|---|
| Basmati rice (raw) | 120 | ₹14 |
| Chicken, bone-in (after 72% yield) | 180 | ₹52 |
| Onion, curd, spices, ghee | — | ₹19 |
| Garnish, raita, salan | — | ₹15 |
| Plate cost | ₹100 | |
| Menu price | ₹340 | |
| Dish food cost % | 29.4% |
Two things fall out of doing this for every dish. First, you find the three or four dishes whose cost has drifted since the menu was printed — chicken and edible oil move every quarter, menu prices do not. Second, you can compare the theoretical food cost (recipe cards × items sold) against the actual one from the stock count. The gap between the two is wastage, over-portioning and theft, expressed as a single number.
Do it monthly, on the same day
Food cost is only useful as a trend. One month is a data point; six months is management information. Count stock on the last day of the month, every month, and put the number on the same sheet as covers, average ticket and labour cost.
If the percentage moves more than two points between months and nobody can explain why, the problem is usually theft, wastage or a portion that quietly grew — in that order of cost, and in reverse order of how often owners suspect them.
Questions owners ask
What is a good food cost percentage for a restaurant in India? For most casual dining and QSR formats, 28–33% of food sales. Fine dining runs higher because the plate is more of the product; cafes run lower because coffee carries the average down. The trend matters more than the number.
Should I include packaging in food cost? For delivery and takeaway, yes. Packaging is consumed per order just like ingredients, and leaving it out flatters every delivery dish. Track it as its own line inside food cost.
How often should I calculate it? Monthly for the full stock-count method. Weekly for your top 10 dishes by revenue, using recipe cards and current purchase prices.
Is purchases ÷ sales good enough? Only if your stock level never changes, which it always does. It is a fair weekly proxy, but the monthly number must use opening and closing stock.
Sources and further reading
- Kasavana, M. & Smith, D. — the menu engineering model, applied in Application of Kasavana–Smith menu engineering model to a resort restaurant, Journal of Hospitality Application and Research
- UNEP, Food Waste Index Report 2024 — food service share of global food waste
- FSSAI, Hygiene requirements under Schedule 4 — storage, FIFO and labelling obligations that also drive wastage control
- NRAI, India Food Services Report 2024, summarised by Restaurant India
Want the trend read for you? Our menu engineering and food costing work starts with exactly this calculation, dish by dish. Or take the Restaurant Growth Score for a five-minute view of where you stand.